Skillsets
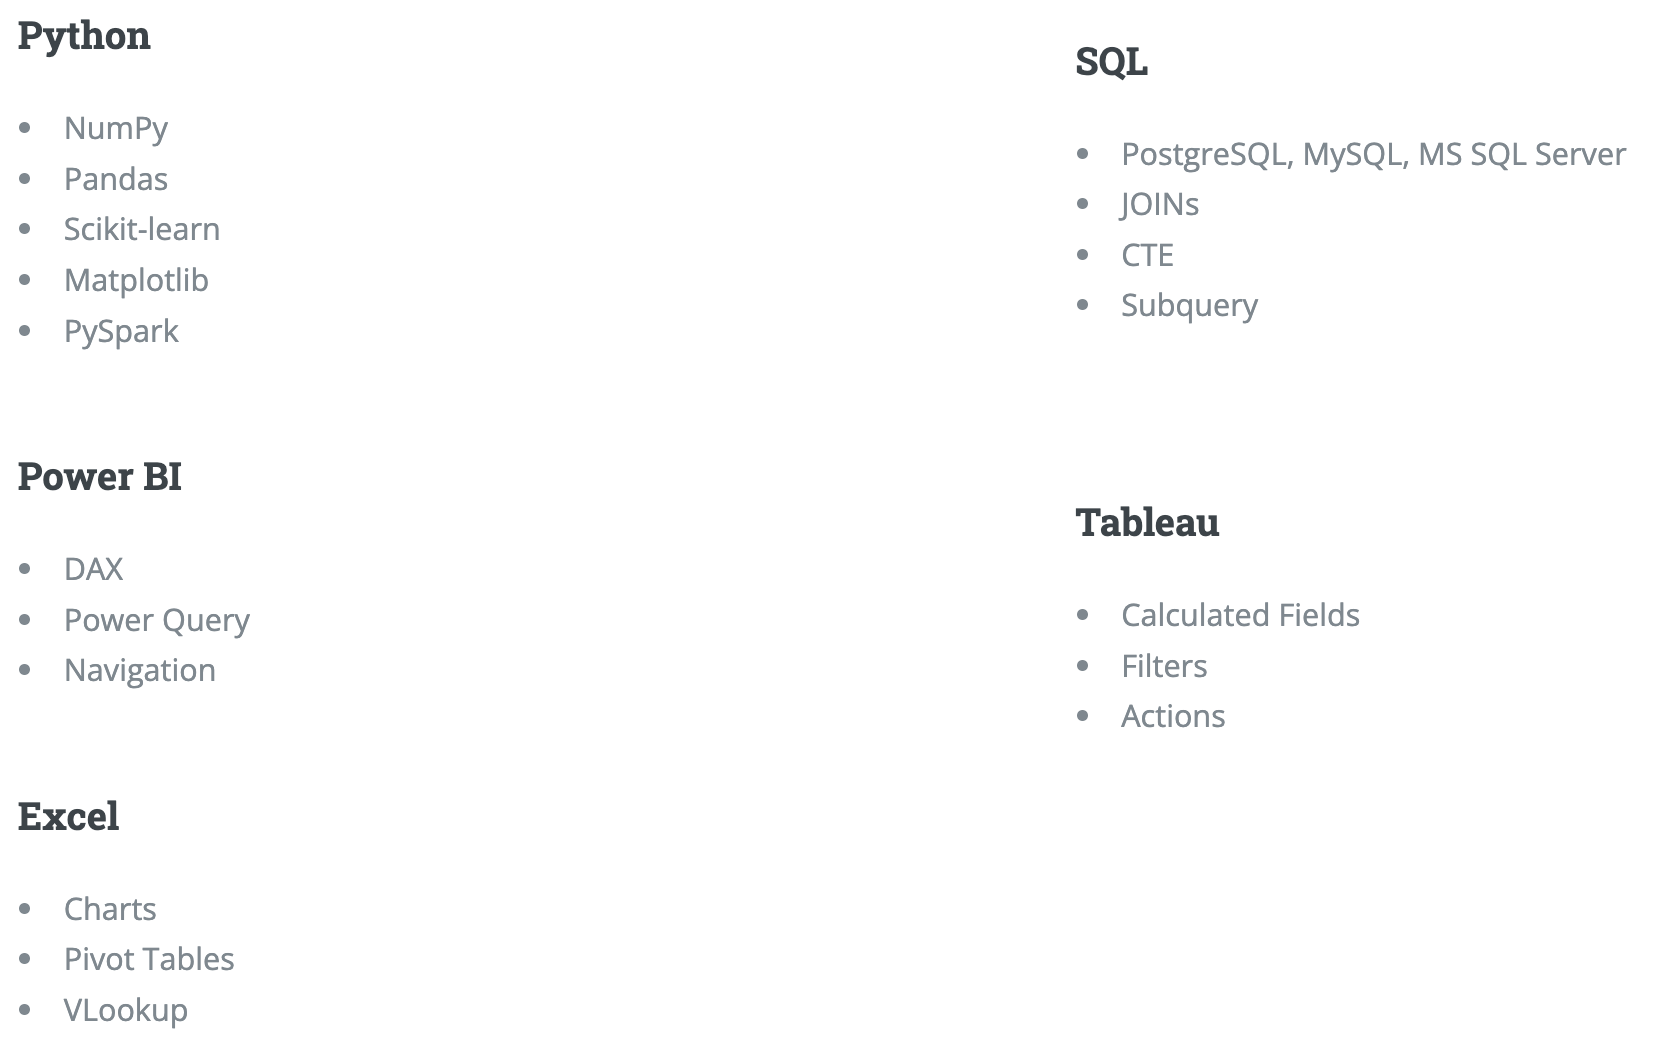
Aspiring Data Analyst skilled in Python, Machine Learning, SQL, Tableau, and Power BI.
You can find me here too: LinkedIn, Tableau Public.

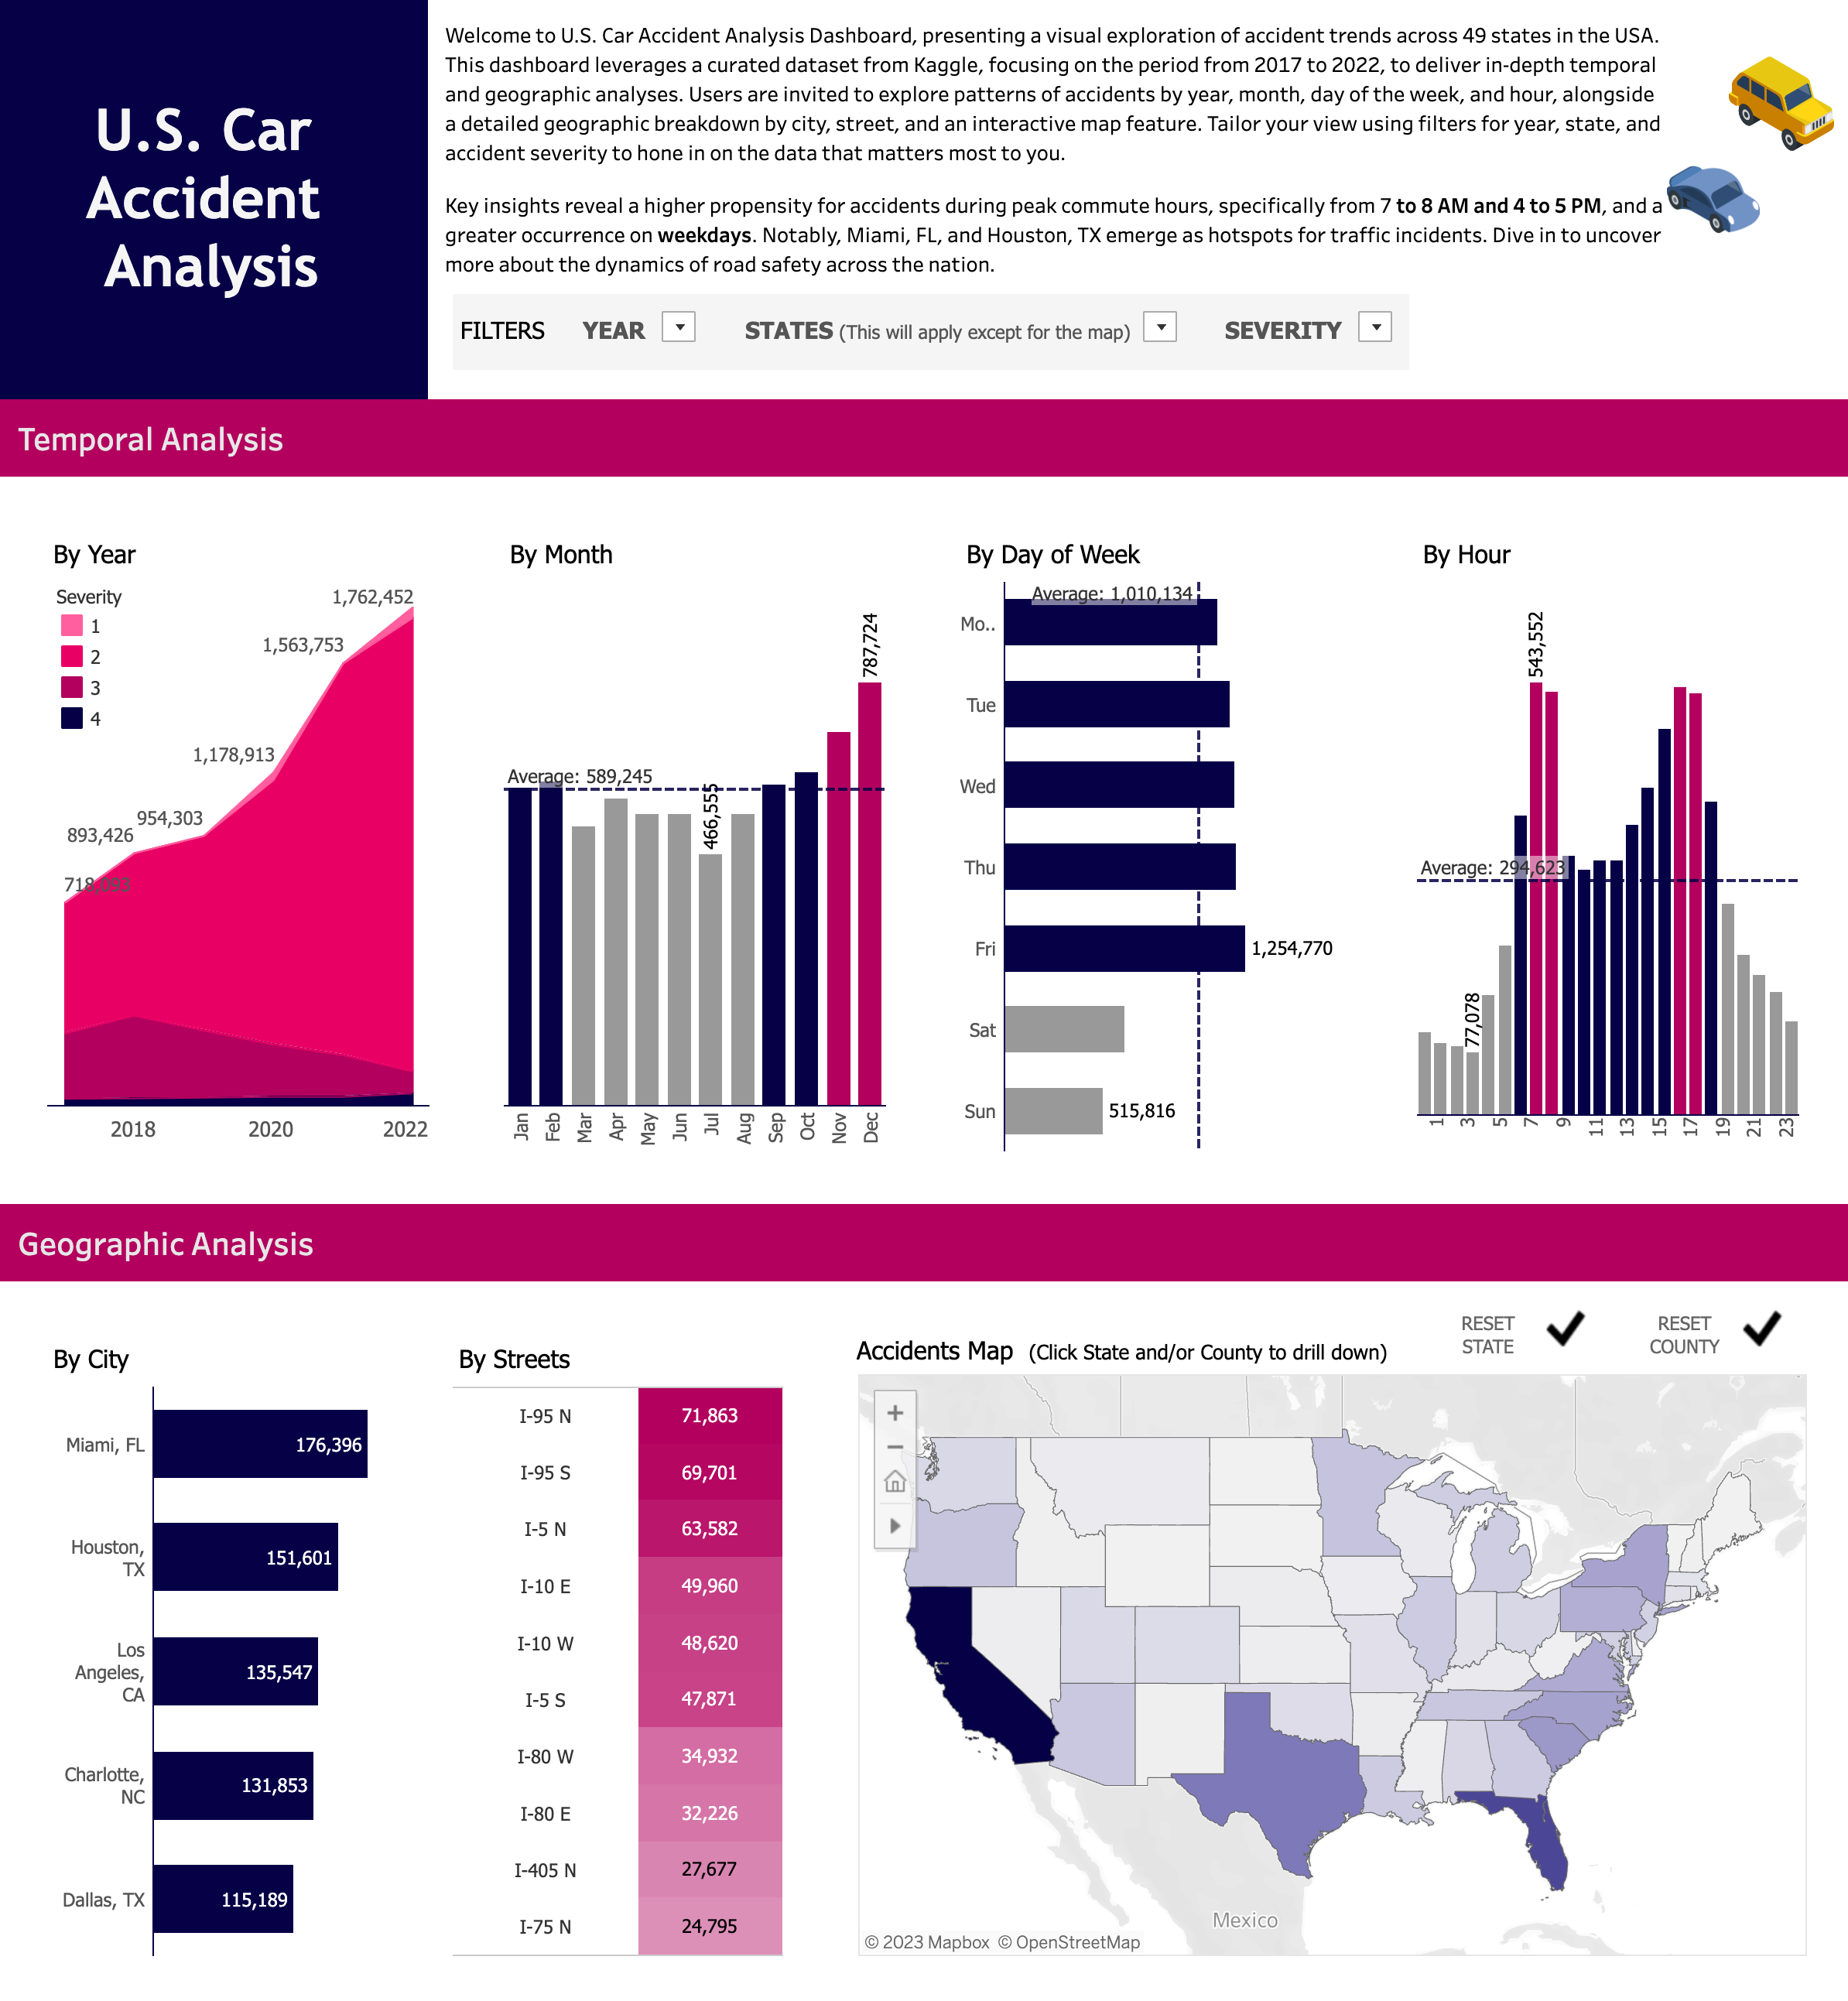
Analyzed U.S. traffic accidents from 2016 to 2023 using SQL for data processing and Tableau for visualization.
The project emphasized temporal trends and geographic distributions to provide actionable insights into accident patterns.
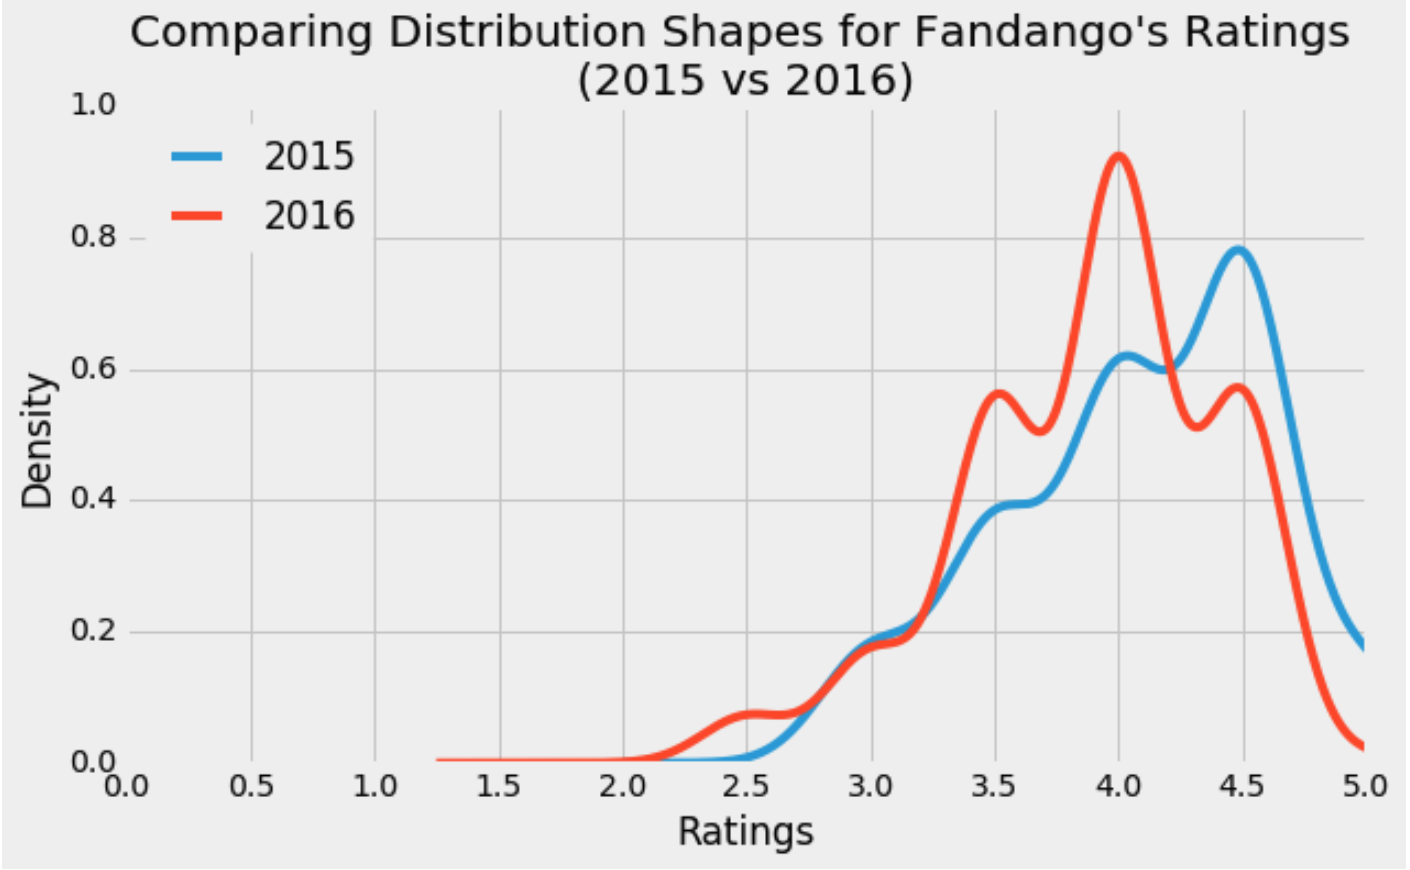
This is an EDA (Exploratory Data Analysis) project using Fandango movie ratings dataset. I performed a comparative analysis between 2015 and 2016 ratings using Python.
In this project, I scraped job data from BC Jobs website, to see which skill sets are most needed. I utilized 'BeautifulSoup' and 'requests' libraries to build web scraping model.
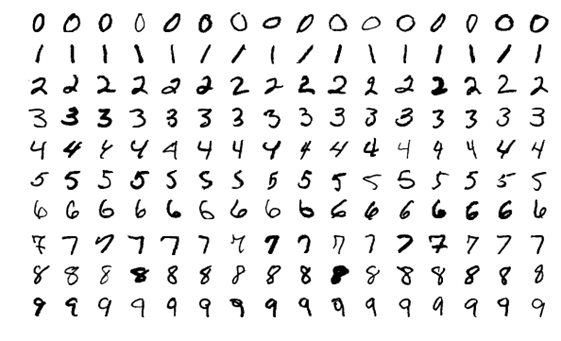
In this project, I built a handwritten digit classifier using Machine Learning algorithms, and validated the accuracy with K-Fold method.

This project is about cleaning and preprocessing the Nashville Housing data in Microsoft SQL Server using various SQL queries from basic joins to CTE.
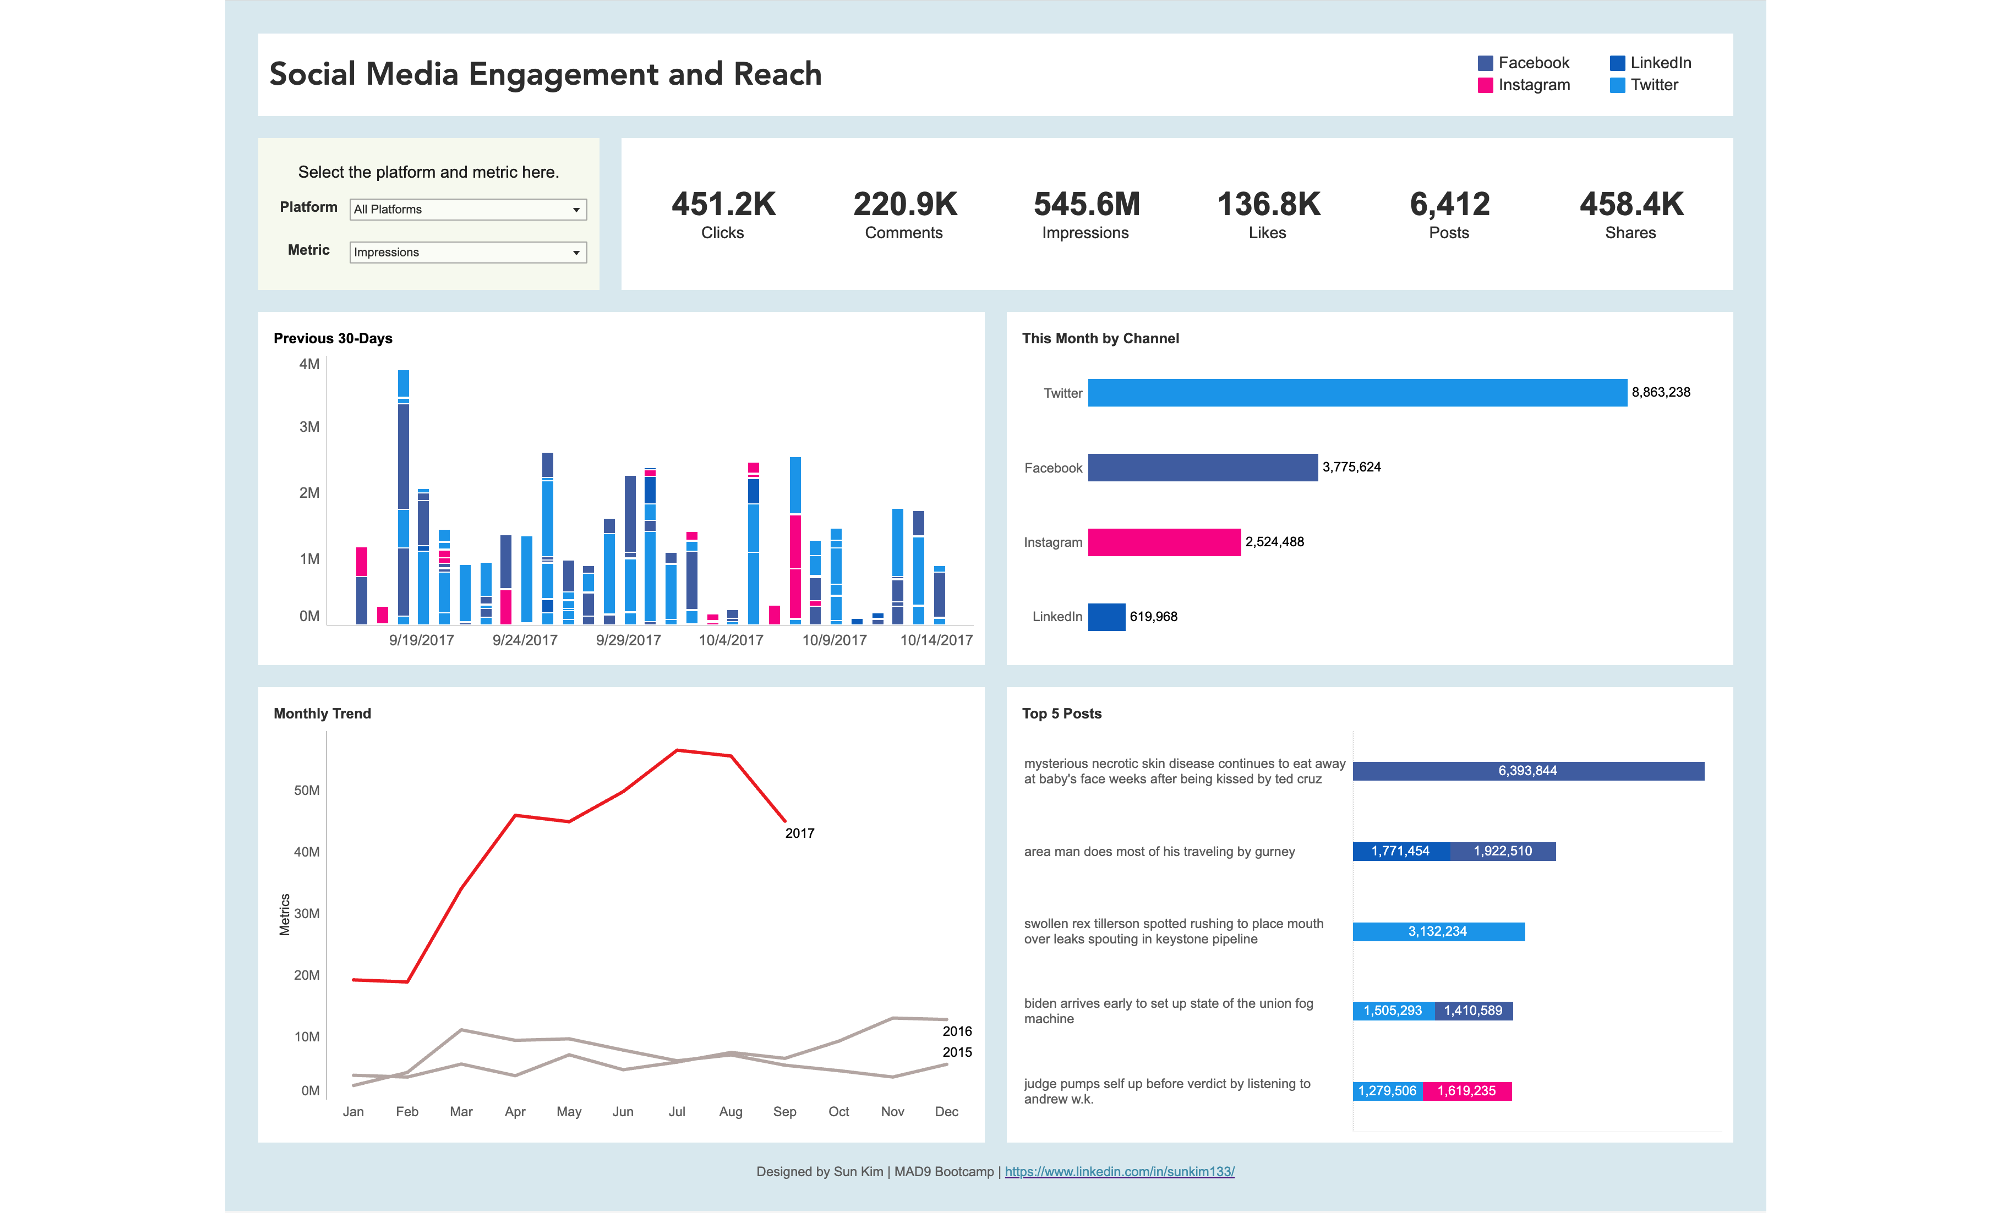
This is an interactive dashboard for social media engagement and reach from the news website "The Onion".
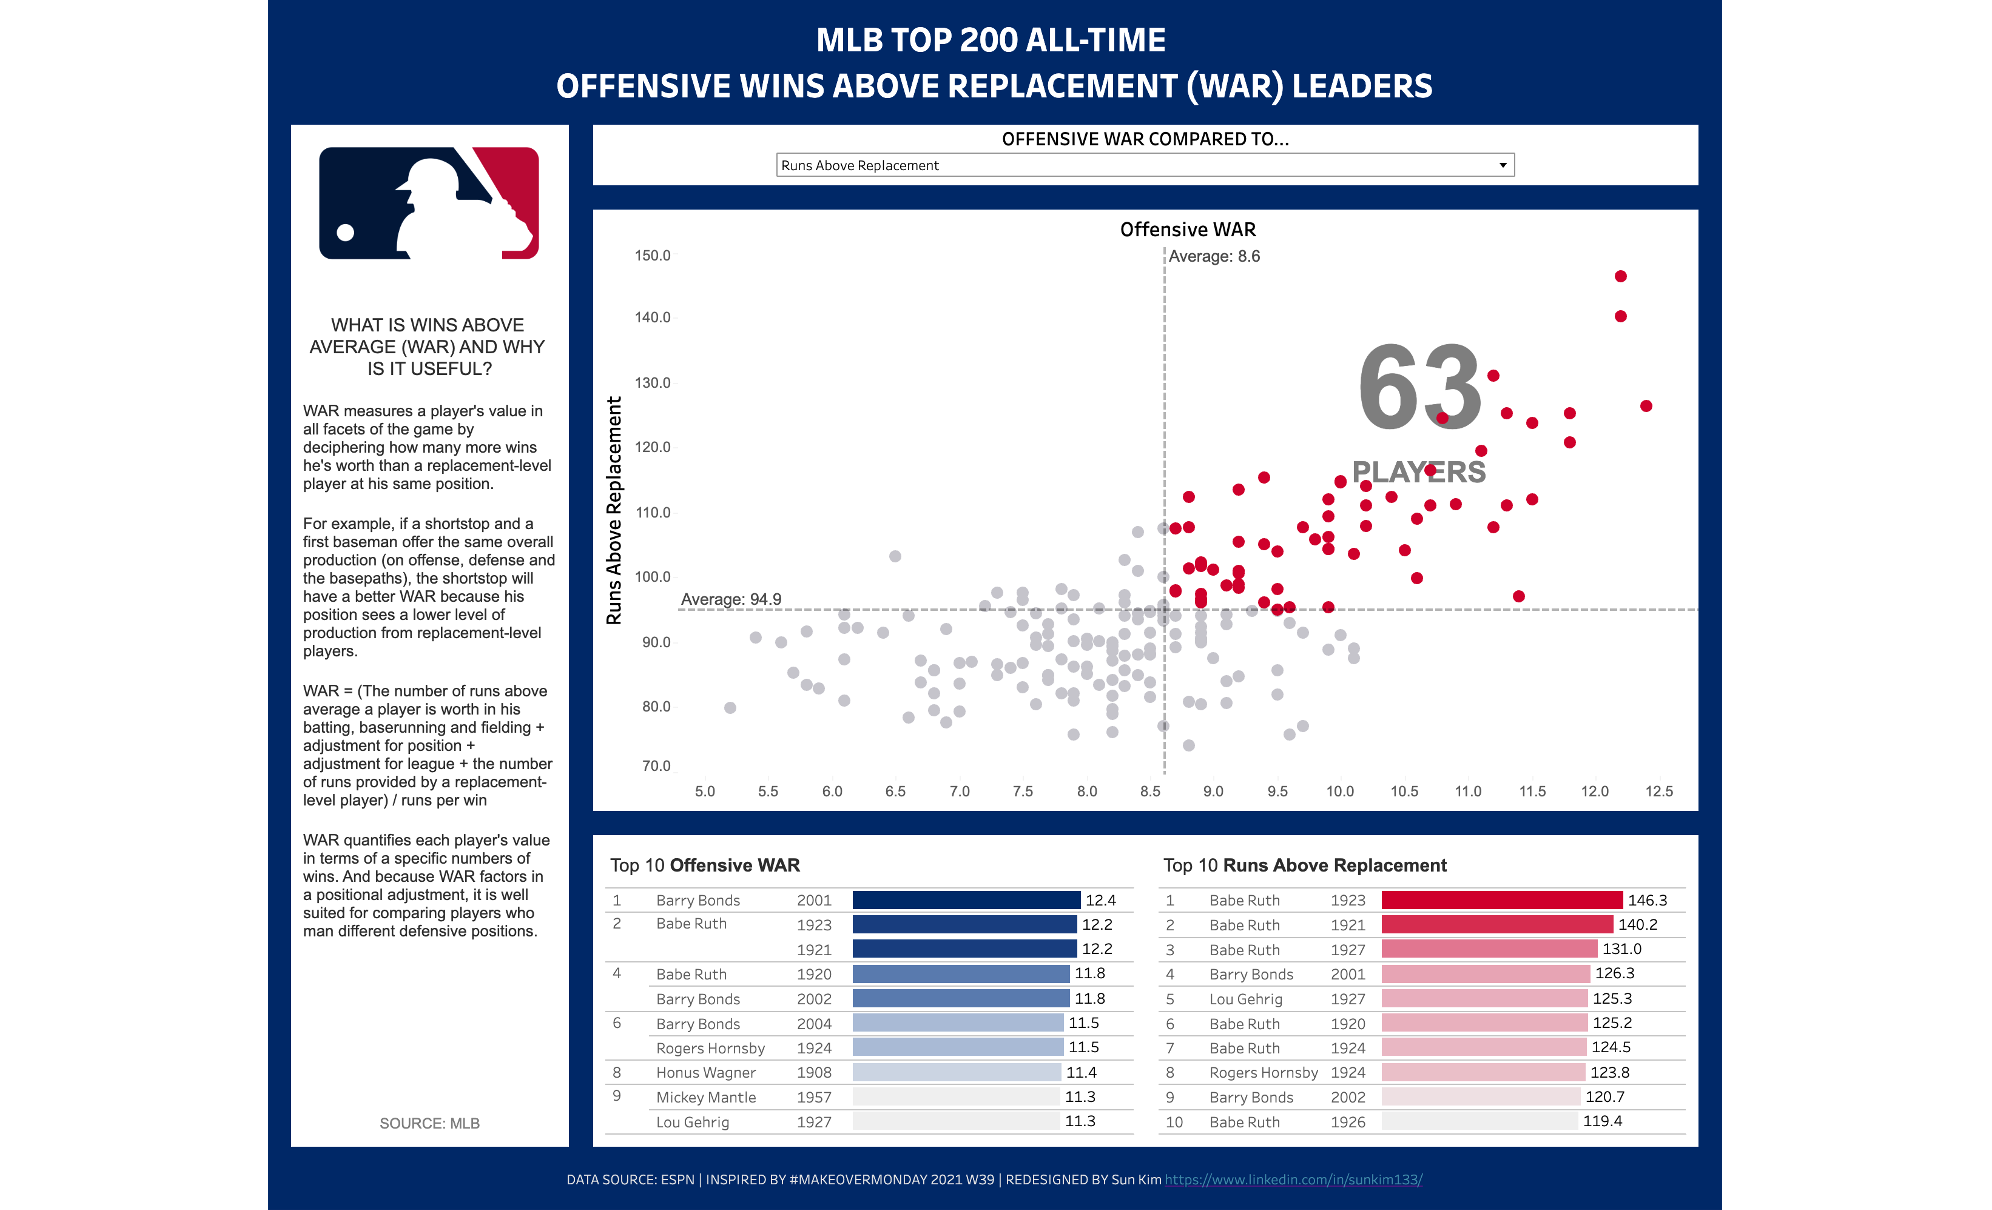
This dashboard shows MLB All-time Top 200 WAR Players and their offensive stats. This project is inspired by #MakeoverMonday.
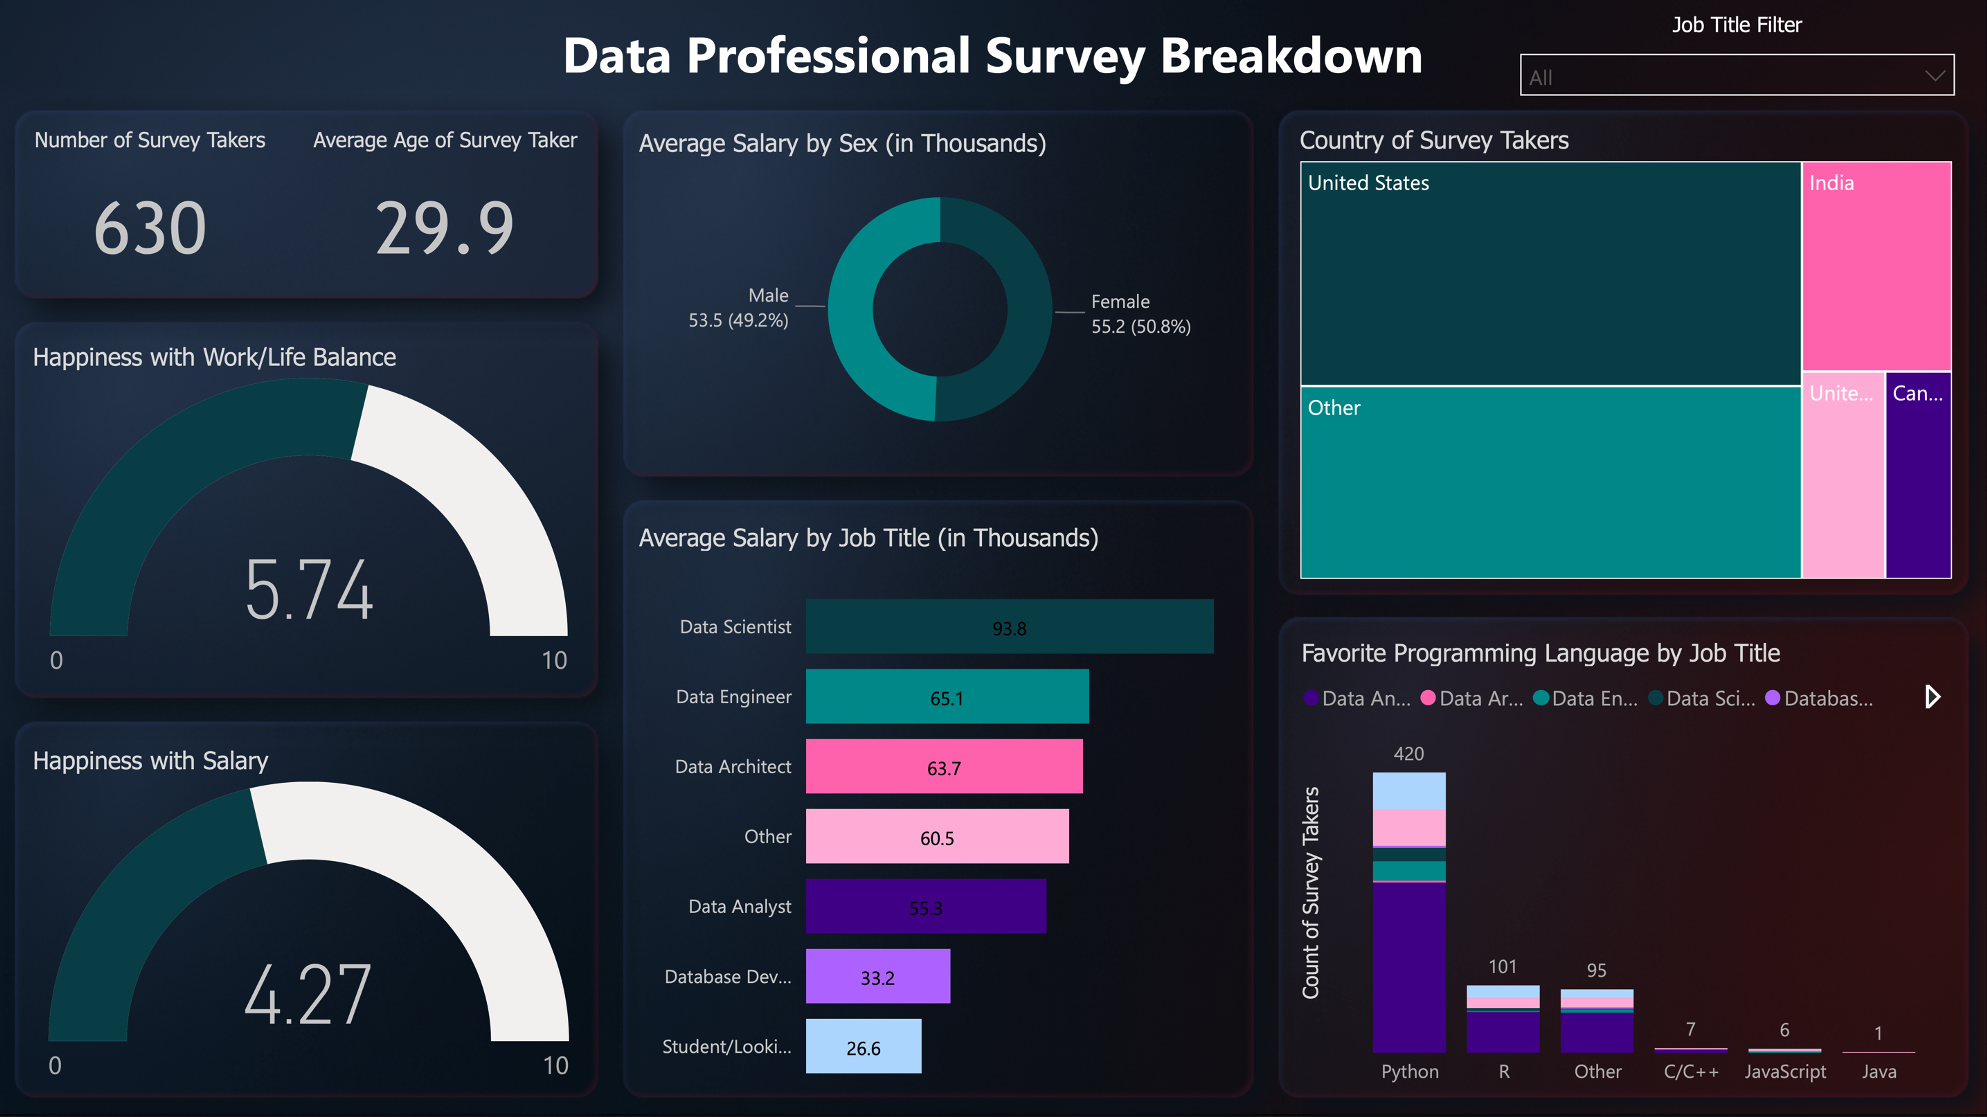
This dashboard shows the result of data professional survey. Using Power BI and Figma, I made a professional-looking dashboard.
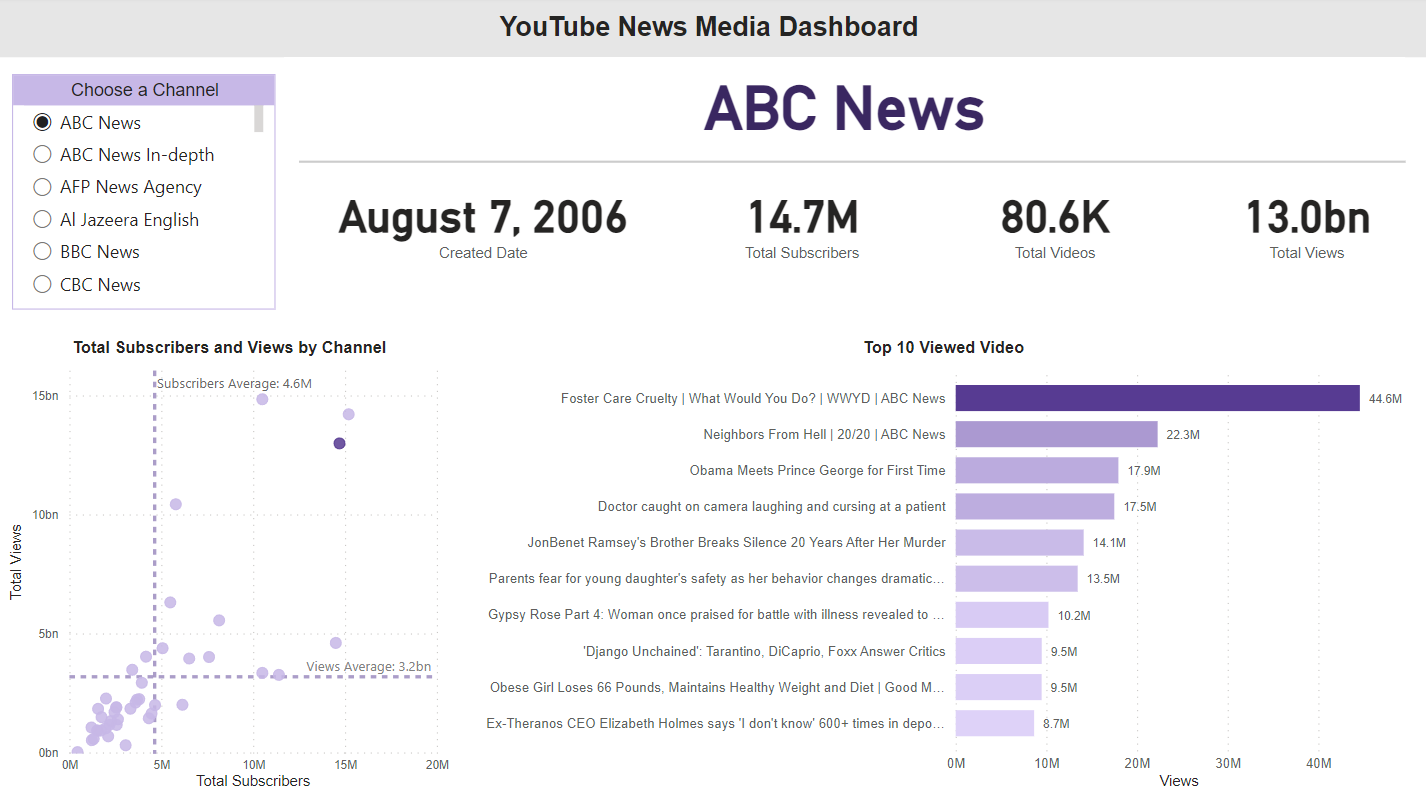
This is an interactive dashboard showing KPIs and top 10 viewed contents by channel. I utilized DAX and Power Query. The dataset is from Kaggle.