U.S. Car Accidents Analysis
Analyzed U.S. traffic accidents from 2016 to 2023 using SQL for data processing and Tableau for visualization.
The project emphasized temporal trends and geographic distributions to provide actionable insights into accident patterns.
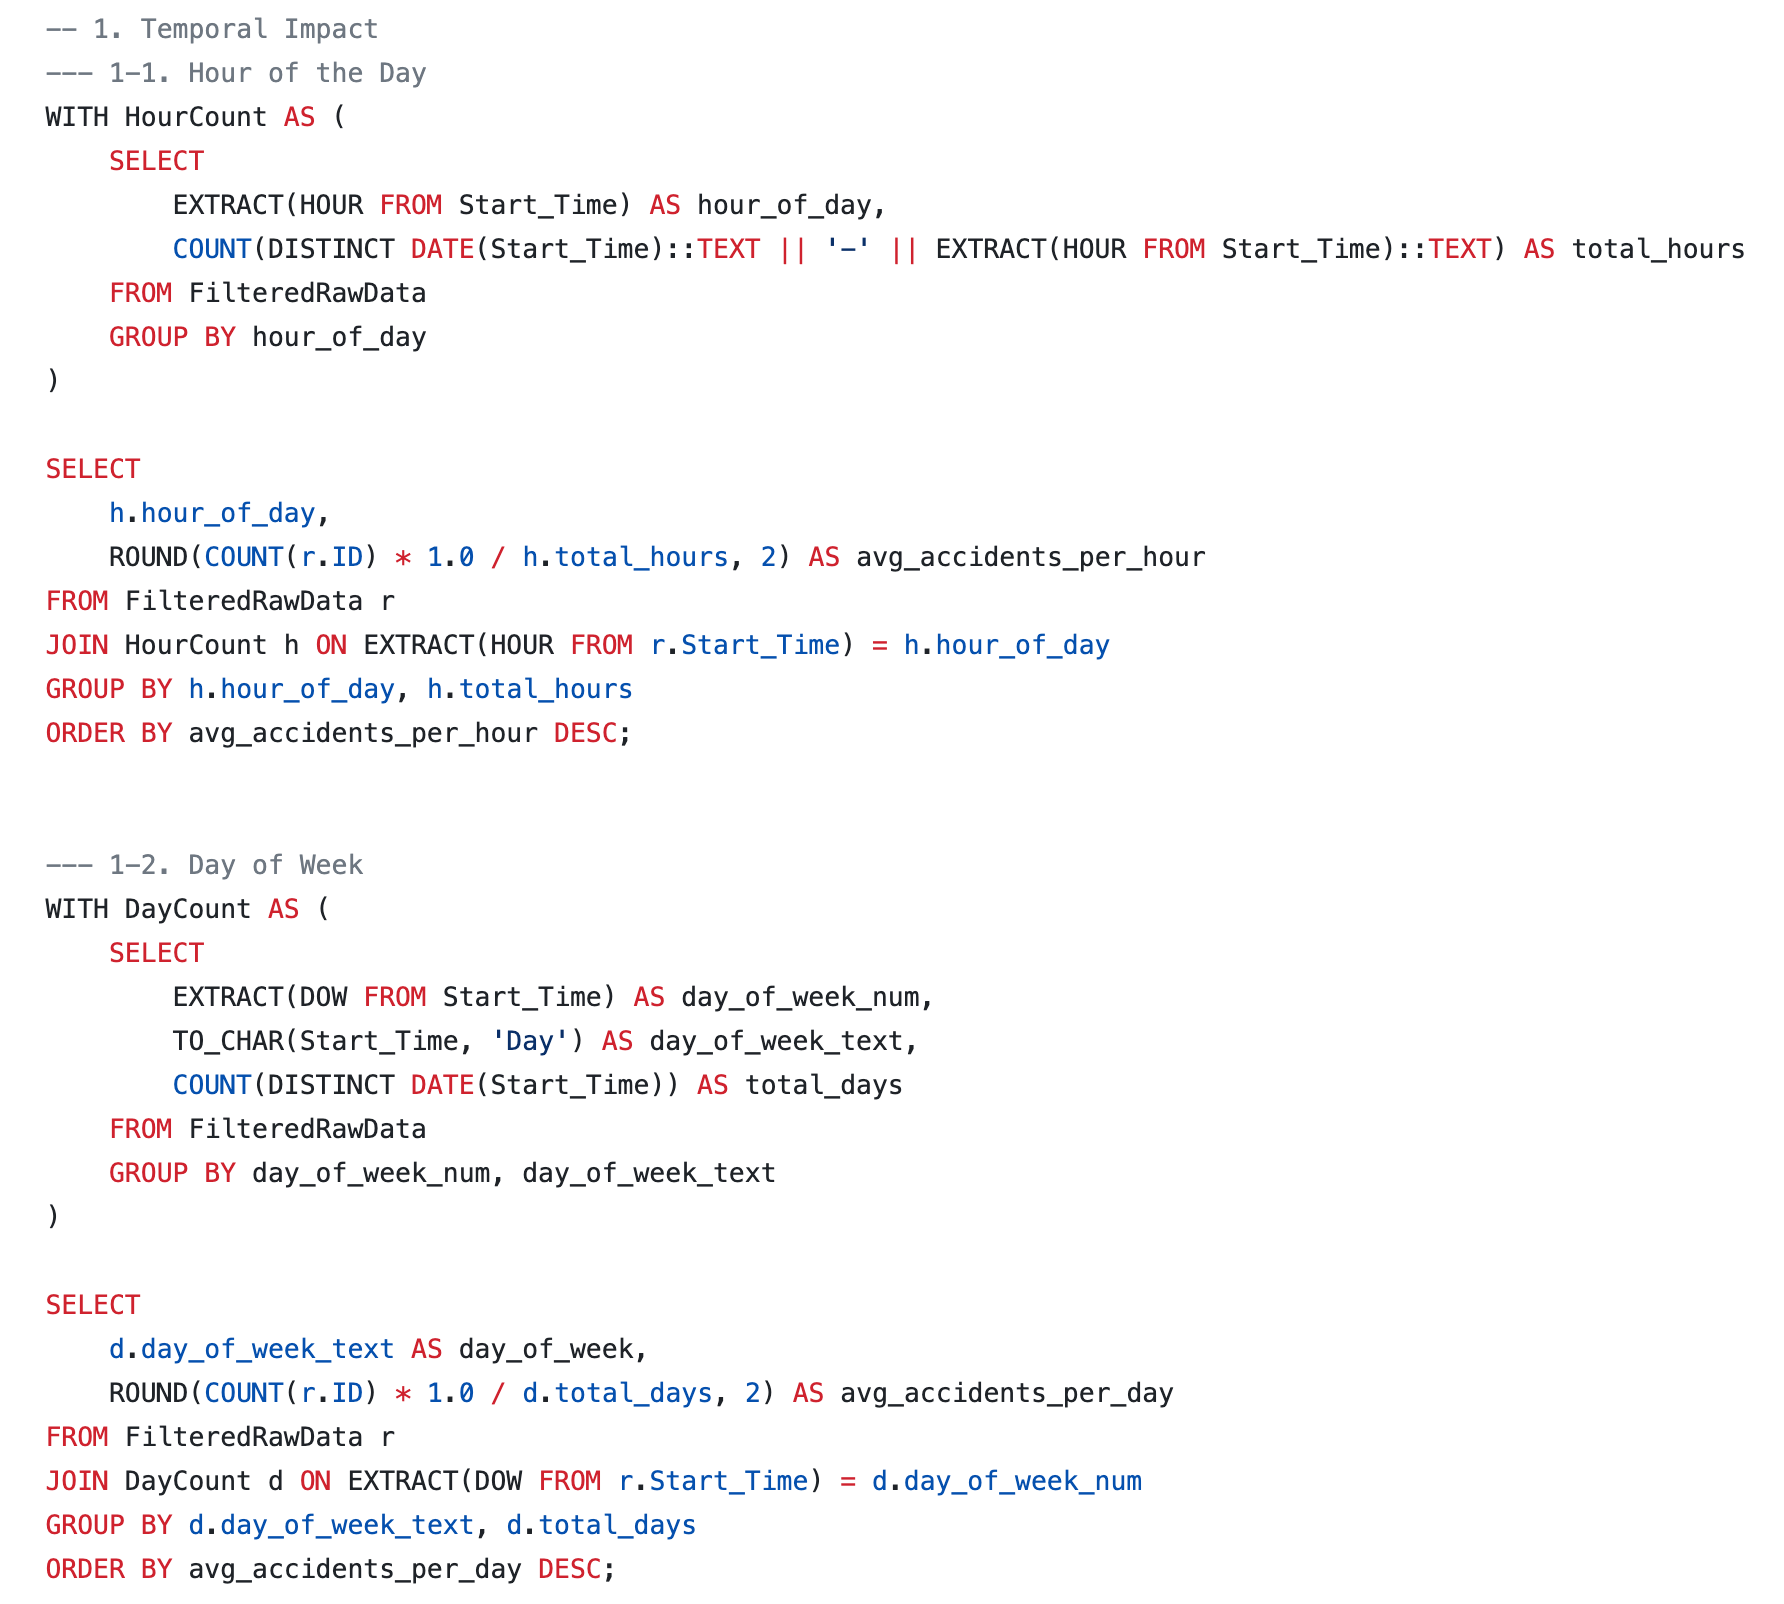
Clicking on the image will redirect you to my GitHub page where you can look into the full SQL query.
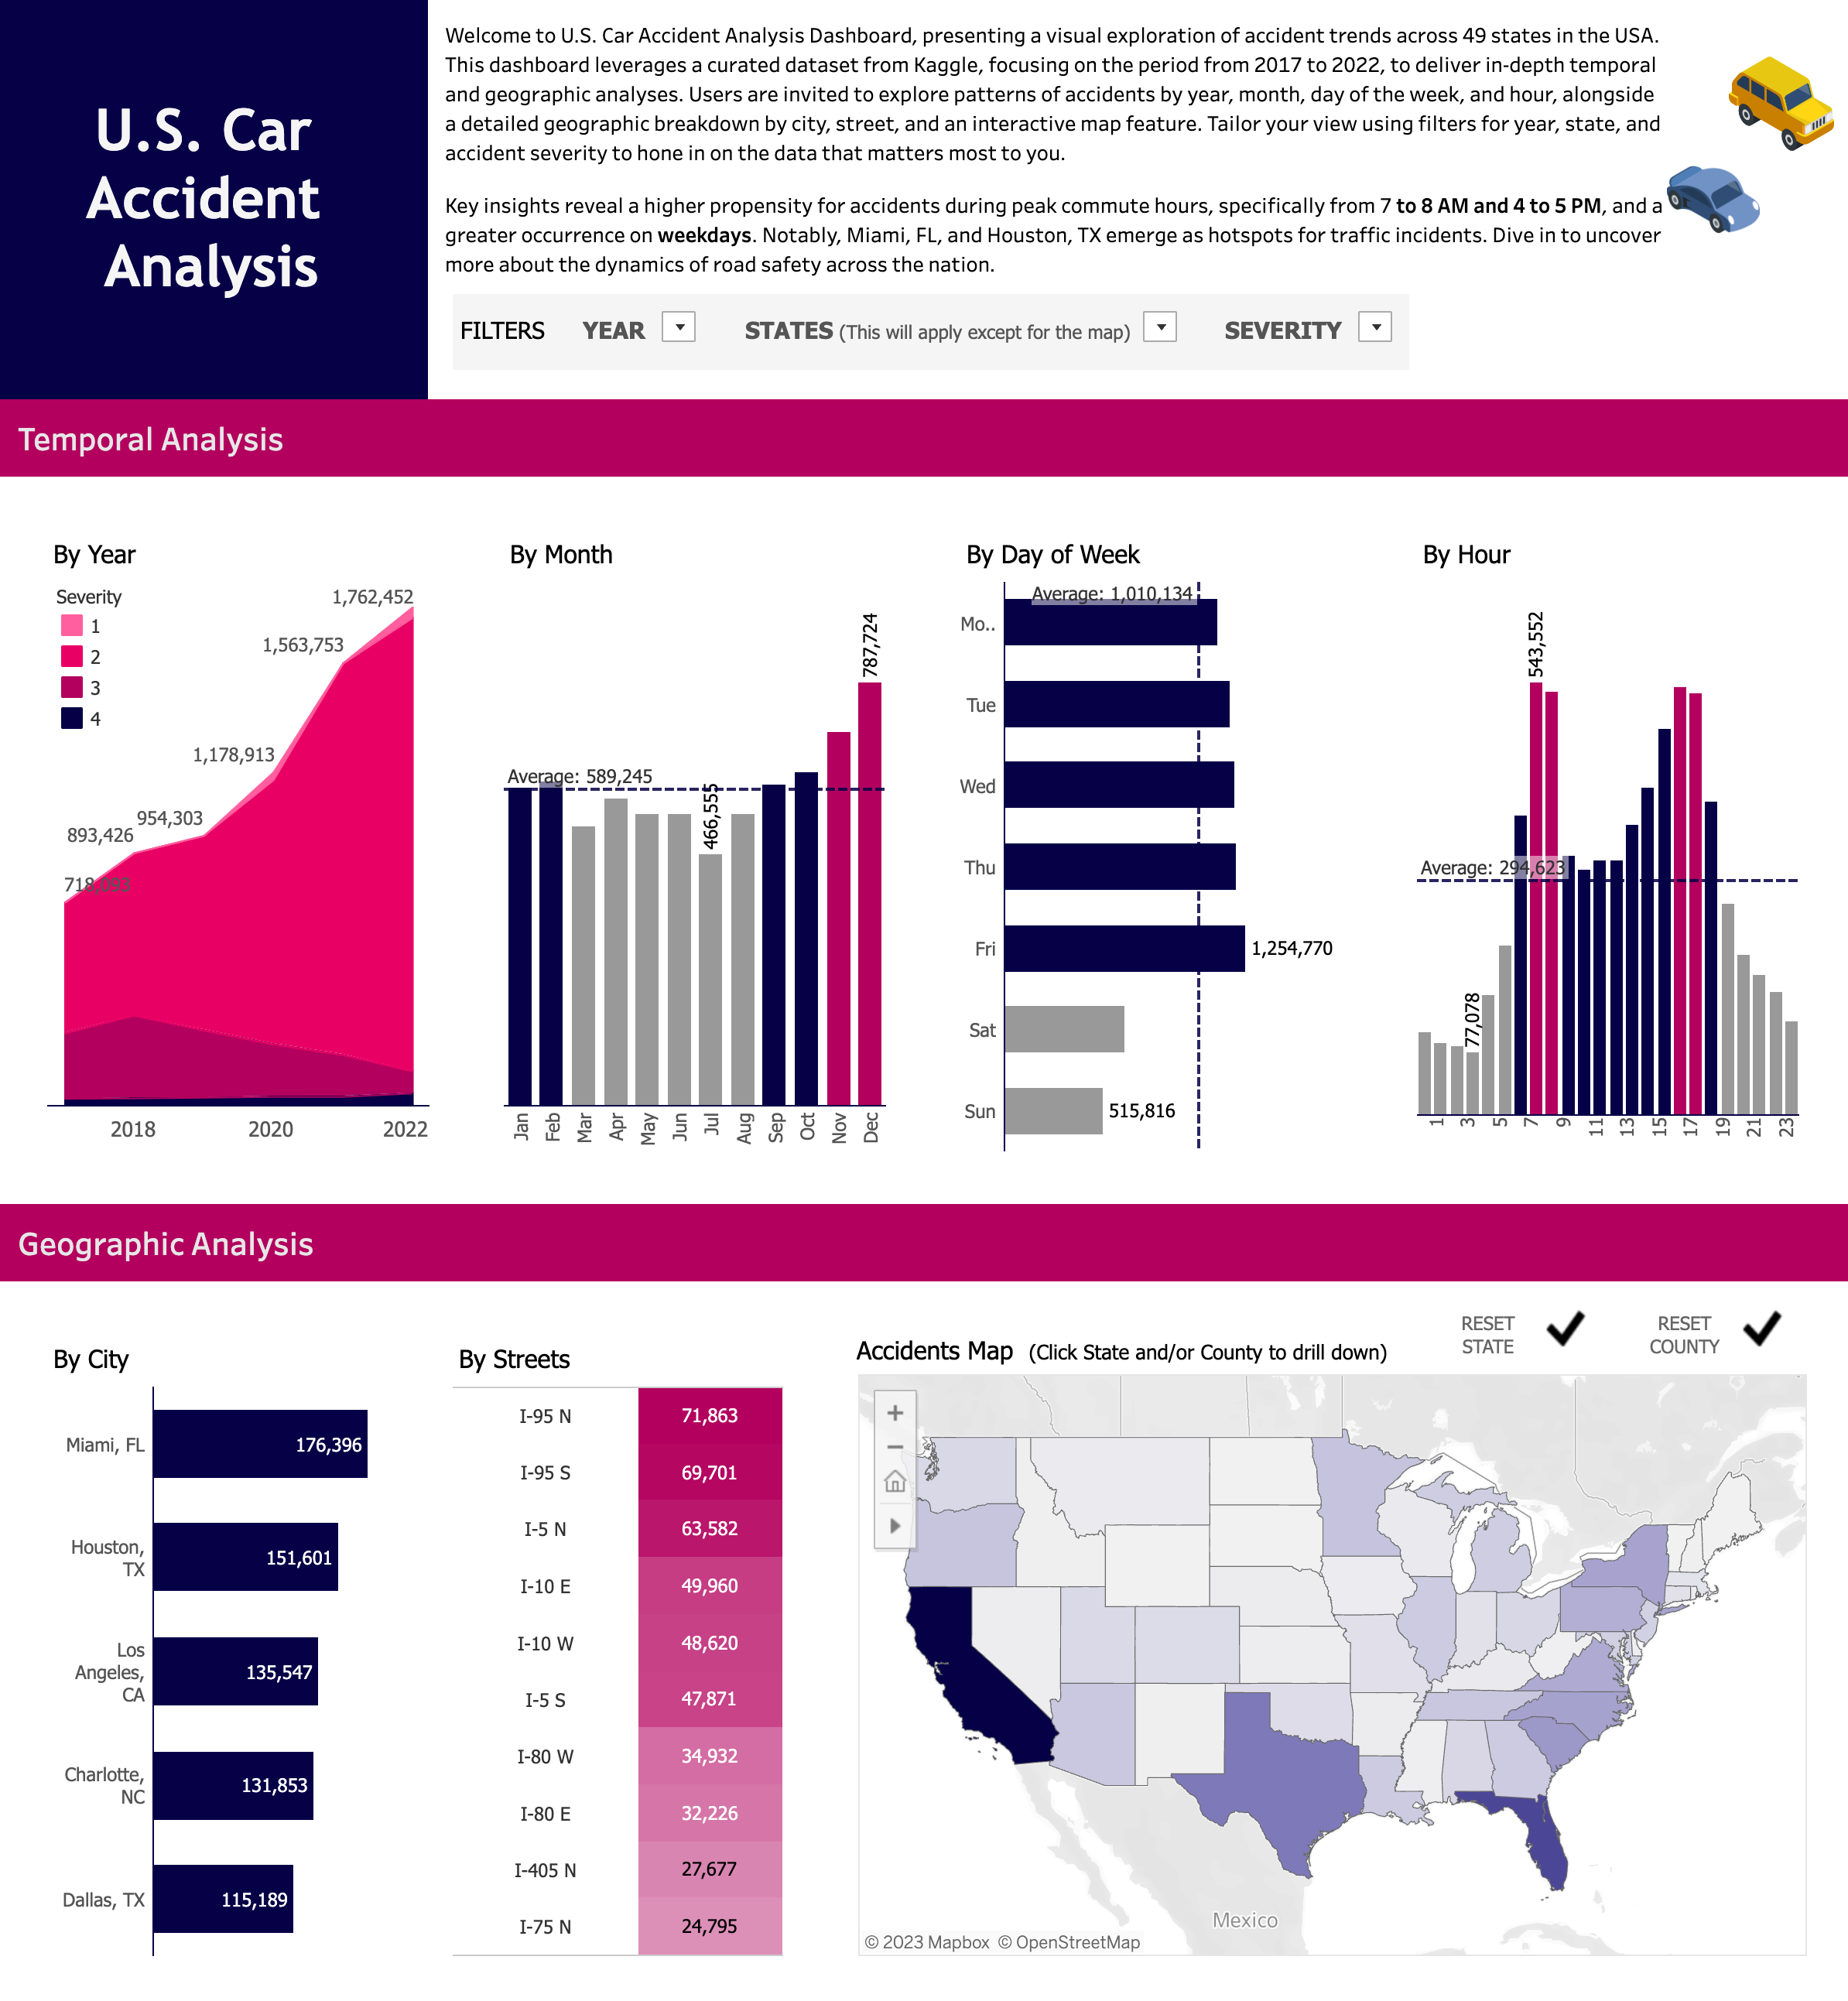
Clicking on the image will redirect you to my Tableau Public page.
The project embarked on a comprehensive analysis of U.S. car accidents from 2017 to 2022. With SQL, the data was not only cleaned and structured but also deeply analyzed to uncover significant insights. We meticulously studied patterns related to time, location, weather conditions, and specific traffic features.
A dynamic Tableau dashboard was built to visually illustrate these findings. This interactive platform enabled users to filter accident data by year, state, and severity, presenting diverse graphs on temporal and geographic trends. One highlight is a drill-down map, allowing users to delve into data at the state, county, and city levels.
Key findings indicated that peak accident times were during commute hours, especially from 7-8 am and 4-5 pm. Weekdays, in comparison to weekends, saw more accidents, with winter emerging as the most accident-prone season.